By now you’ve probably been asking yourself, “What’s with all the green and red squares?” Well, each square, or metric, tells you something meaningful about the resource that it belongs to. The expression and Metrics are at the heart of TWS. In fact, I created metrics first and then went back and uncovered the math behind it. The expression is the behavior of a resource. If the components are like the DNA of a resource, the expression is the physical manifestation. It is composed of 4 factors that are derived from formulas taken from the relationships between various components.
How do you determine the factors for a resource? You can use the following formulas to do so. In your system worksheet, make sure the expression is an actual formula instead of just a static number. Once you do this once, you should be able to reuse it for all other resources.
The Fiber Metric

By dividing the number of Calories by the amount of fiber, you will obtain a number that will help determine the overall fiber value of the resource. You can use this number when trying to decide between closely related resources. This is used to maximize fiber and minimize Calories. For example:
The F for 1 Nutrition Bar is 220 Cal/14g Fiber: 220/14 = 15.7F
This bar would be considered an overall great source of fiber value; anything less than 50F is an overall good choice. We can also tell how this nutrition bar compares to other bars in the grocery store, so you can get the bar with the highest fiber value. If there are no Calories, the F bottoms out at zero, and if there is no fiber, it is undefined.
The Protein Metric

By dividing the number of Calories by the amount of protein, you will obtain a number that will help determine the overall protein value of the resource. You can use this number when trying to decide between closely related resources. This is used to maximize protein and minimize Calories. For example:
The P for 1 Nutrition Bar is 220 Cal/13g Protein: 220/13 = 16.9P
This bar would be considered an overall great source of protein value; anything less than 30P is an overall good choice. We can also tell how this nutrition bar compares to other bars in the grocery store, so you can get the bar with the highest protein value. If there are no Calories, P bottoms out at zero, and if there is no protein, it is undefined.
The Wholeness Metric

By aggregating the F and P, you will obtain a number that will help determine the overall wholeness and nutritional value of the resource. You can use this number when trying to decide between closely related resources. This can also be used to maximize overall value and minimize nutritional incompleteness. For example:
The W for 1 Nutrition Bar is: 15.7F + 16.9P = 32.6W
This bar would be considered an overall great source of wholeness; anything less than 80W is an overall good choice. We can also tell how this nutrition bar compares to other bars in the grocery store, so you can get the bar with the highest overall nutritional wholeness. If either F or P are undefined, the W is also undefined.
The Energy Metric
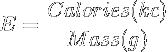
By dividing the number of Calories by the amount of mass or quantity, you will obtain a number that will help determine the overall energy density of the resource. You can use this number when trying to decide between closely related resources. This is used to minimize high-Calorie foods or balance them out by pairing them with low-Calorie foods. For example:
The E for 1 Nutrition Bar is 100 Cal/25g: 100/25 = 4E
This bar would be considered too energetic to be eaten by itself; anything less than 1E is an overall good choice. We can also tell how this nutrition bar compares to other bars in the grocery store, so you can get the bar with the lowest energy density. If there are no Calories, the E bottoms out at zero, and if there is no quantity, it is undefined.
There are five main considerations to E, namely protein, sugar, oil, alcohol, and mass. These variables give you a formula for a quick estimation of E.


The way to read and understand this expression is as follows:
E = energy value, p = protein, s = sugar, o = oils, a = alcohol, m = mass
When E is low, p, s, f, and a also tend to be low, except for m which tends to be high. On the other hand, when E is high, p, s, f, and a tend to be high, except for m which tends to be low. That means that people who have high energy value eat small amounts of protein, sugar, fat, alcohol, and large amounts of mass like water. Similarly, people who have a low energy value eat large amounts of protein, sugar, fat, alcohol, and small amounts of mass like water.
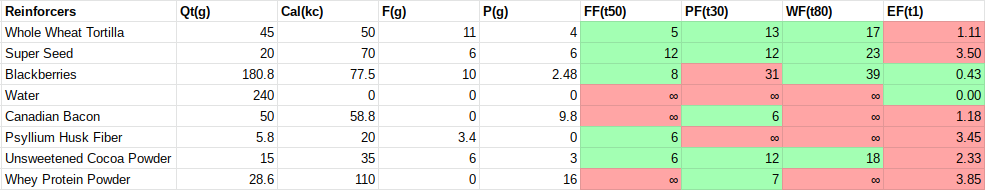
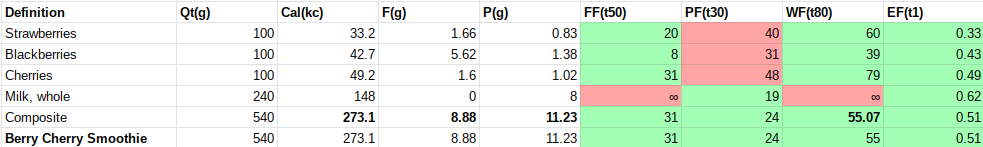
You can see all 4 metrics in the figure below. A metric is either green or red depending on whether it meets the defined threshold. Metrics use thresholds instead of ranges. TWS thresholds are all inversely proportional. This means that lower numbers have higher values. You can see below that the first 3 metrics are below threshold and the last is not:

The Metrics Become the Wellness Formula
Using the four metrics above, we can blend them together into a system of literal equations. This system of equations is called The Wellness Formula and is at the fundamental core of each resource. Each resource has 4 components which are just inputs fed into the system. But once that happens, the system comes alive. Mathematically, the system emerges from the metrics:


In the first line, we see the basic relationships between the amounts of fiber, protein, and Calories. Then we add both of those equations together to understand the relationship between the first two metrics. The third equation defines W as a higher order metric, or rather a metric made of metrics. To simplify all this information, it is written in a straight-forward, user-friendly form.
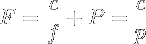
The second equation in the formula, which is also the fourth metric, is already in simplest form:

Then we can group these simple equations together as a system:

This formula defines the operations that are performed on the components of each resource and is therefore responsible for the values of each metric. W tells us about the nutritional information of the resource, and E tells us about the leanness and energy density. Each equation operates independently from one another but says something unique about the resource in question.
Let’s do a very simple example of using The Wellness Formula:
Using the components f, p, and c, fill in the variables and solve for W:


Using the remainder of the components (m), solve for E:


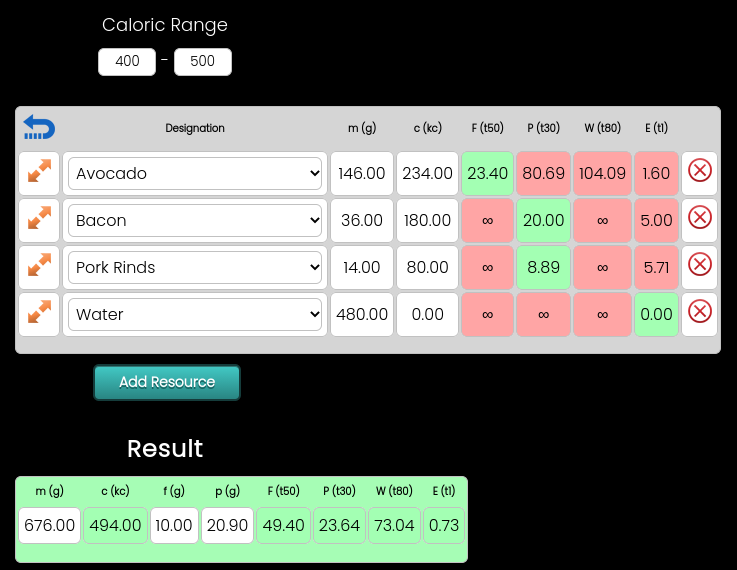
Now we have a solution to each equation in the Wellness formula. Even though this resource doesn’t exist, we can still infer information about it for example, this imaginary resource is complete (has a solution for both sub-equations), it is very high in nutrition, and has an elevated E which indicates the presence energy. Since this doesn’t normally happen for a singular resource in nature, we can conclude that this must be a sandwich or a salad.
The Threshold Formula
Part of the basics of The Wellness System is the usage of thresholds and non-linear functions. It uses thresholds as a means of expressing desirable or undesirable behavior. One metric that is above a threshold is not a problem, however when every resource in your formation is red, that’s a clear indicator that you need to rethink your meal.
When working in your worksheet, it can be overwhelming with all the numbers flying around. So, I created the threshold formula to help you visualize the properties and the metrics of a resource. The Threshold formula is an auxiliary system of equations, part of The Wellness System, designed to help you make sense of all the data you are working with.

In each equation, the variable t represents a corresponding metric’s value. Also, every initial number is the threshold for that particular metric. Here is an example of reducing the threshold formula:


As you can see, this resource is undesirable. It is over threshold in every single metric, even though not by much. However, mixing it with a more desirable resource could make it more desirable.
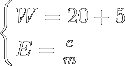
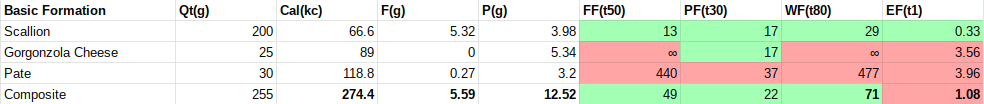
Lets try out using the Wellness formula and the threshold formula with, say, bean sprouts:
First we solve for W by using the information on the nutrition label (c, f, p):


Next E. We solve for E by using the nutrition label as well (c, m):

Now we determine the threshold factors:

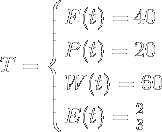
Initially, W and E have to be solved before we can begin to make inferences about the sprouts. After W and E are solved, we can begin to determine the threshold factors. First, we plugin the values for each t according to each threshold. Second, we solve for each equation and determine the threshold factor for each metric. This gives us a lot of detail about each metric instantly, i.e. all the metrics are under threshold (all positive), W has the highest score, this resource has twice as much fiber value as protein value, etc.
Comparative Analysis
You don’t have to apply both equations or use the threshold formula in order to make inferences about the component information. For example, you can use W to compare canned goods at the grocery store. Or you can use E to uncover which meat is leaner. But for example, we are going to perform a complete comparative analysis on these two protein shakes.
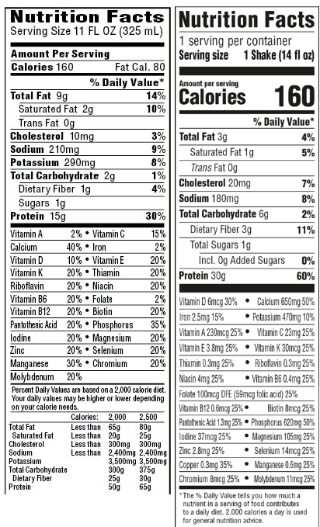
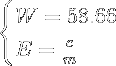
Evaluate the nutrition label on the left:


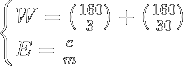
Evaluate the nutrition label on the right:

Now we can compare and analyze. I added the threshold formulas as well:


Now, this starts out a little deceptive. For any calorie counter, they would look at both and see that they both have the same number of calories. So they might think it’s a toss up and choose the one that looks more enticing. But there is useful information hidden in the label that TWS will bring out.
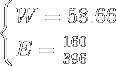
Looking at the Wellness formulas, the left has a high W which indicates very low nutritional value. The E is about average. The right has a lower W which indicates a higher nutritional value, and E is .4 which is about normal. Just by looking at the Wellness formulas, we can tell which is a better choice; the right one.
Just for fun, lets add the threshold formulas into the mix. Looking at the left thresholds, we can now see why the W is so high. The fiber value is 110 above threshold which pushes the W up to 90.6 above threshold. The protein value is not impressive, it’s close to threshold, and the E is normal.
When comparing resources, the difference between the two values for W will give you a gap between the value and the threshold. This is what the threshold formula measures. Secondly, the difference between the two values for E will give you a gap between the values and the threshold. You can then make an inference based on the two values.

Sometimes a component can be zero causing W to be infinite. For example, fiber is zero for meat resources. When fiber or protein is zero, the corresponding F or P is infinite. We can show that this is the case by decreasing the amount further and further towards zero and the result is a metric that grows higher and higher. So the actual metric for a zero fiber or protein amount is infinity.
This presents a challenge with W since it is the sum of F and P. If F or P is infinite, W is also infinite. For infinity plus a normal integer is infinity. Resources that have an infinite W are called incomplete and are usually sorted by the E instead of the W. This is why a map structure has two lists, one for complete resources (W is finite) and the other for incomplete resources (W is infinite).
You can still use incomplete resources for the value they contain. For example, meats are incomplete however they usually have some of the highest protein value of any resources. You don’t have to worry about division by zero in the components. A component that is zero will simply aggregate to zero.
If the number of Calories is zero and the fiber, protein, and mass are non-zero, the expression is all zeros. This rarely happens since the presence of protein has Calories. More common is when the mass is non-zero and Calories, fiber, and protein are all zero. This creates infinity in F, P, and W and zero in the E. This is the signature of water.
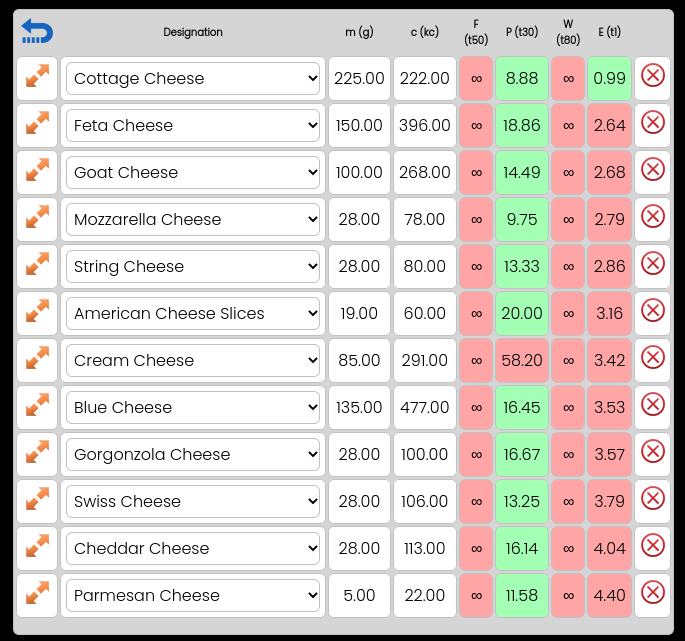
Here is a resource that has zero fiber and therefore an infinite F and W:

Notice how this resource still has useful information even though W is infinite; we know that E is .54 which is below threshold and that P is 5 which is way below threshold. So, even though egg whites have an infinite W, they are a fantastic choice for protein value and energy value.


 The Wellness System