Ketogenesis

Keto is the newest craze. The big question is, “Is it healthy?” The answer is yes, if done correctly. It depends on 2 factors, calorie range and drinking enough water. Those who take an “eat as much as I want” approach will find that they don’t lose weight as expected. It is necessary to eat smaller portions because almost everything on keto has a high energy density (fat). And this also requires lots of water to balance it out. 

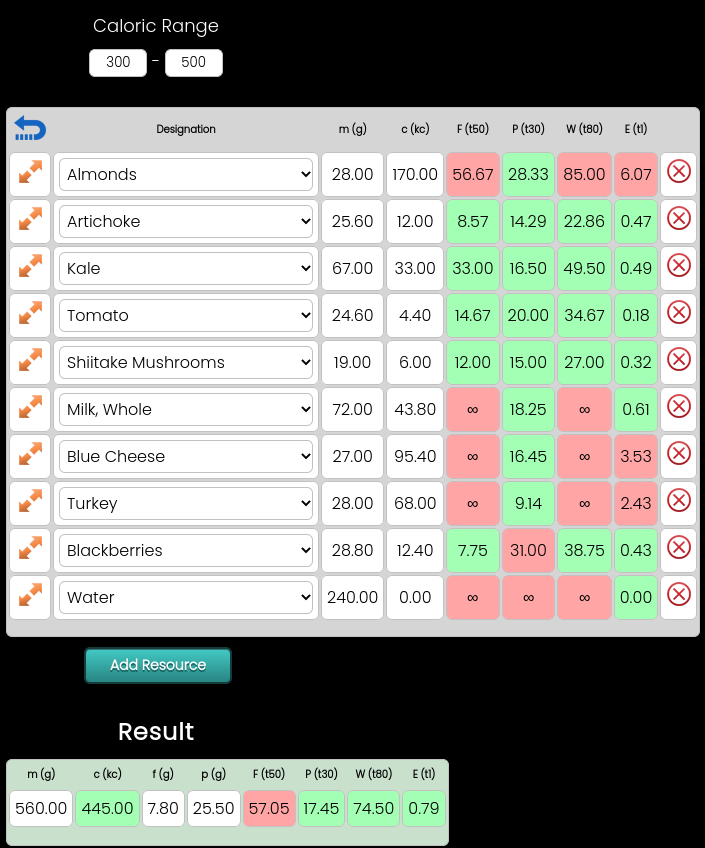
Ketosis is a great metabolic pathway because your body burns fat instead of sugar. Fat has 9 calories per gram and sugar has 4 so ketosis is more efficient. Burning fat instead of sugar causes your insulin levels to remain extremely low which improves insulin sensitivity and prevents metabolic syndrome. It also improves satiety because fat is more filling than sugar. Below is a keto meal. Notice you have to drink more water to balance it out.

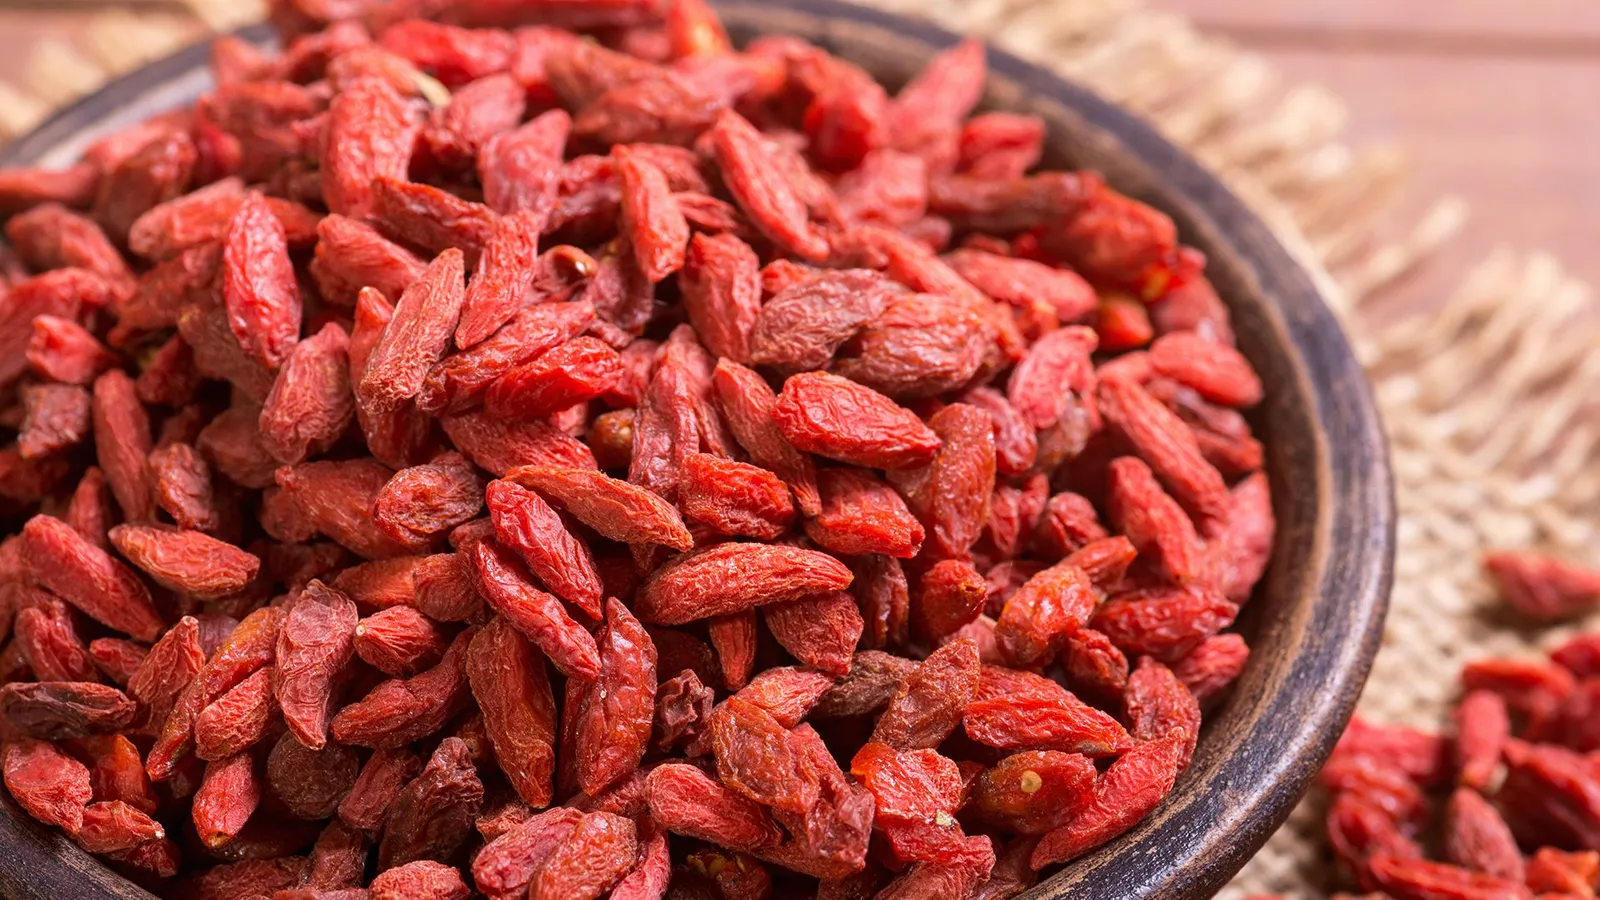
Goji Berries

Image Source

The Goji Berry is one of nature’s most nutritious and versatile fruits. It is high in fiber value and protein value and has energy to give you a boost. Goji berries, or wolfberries, contain the following health benefits:

  • Vitamin C
  • Vitamin A
  • Fiber
  • Iron
  • Protein
  • Antioxidants

They protect the eyes, provide immune system support, protect against cancer, promote healthy skin, stabilize blood sugar, improve depression, anxiety, and sleep, and prevent liver damage.1

They can be used for cooking in a variety of ways or can be eaten as a great snack! Just be careful you don’t overdo it because they are naturally high in carbs and aren’t ketogenic.

1 – https://www.medicalnewstoday.com/articles/322693#_noHeaderPrefixedContent

The Expression (Metrics) of a Resource

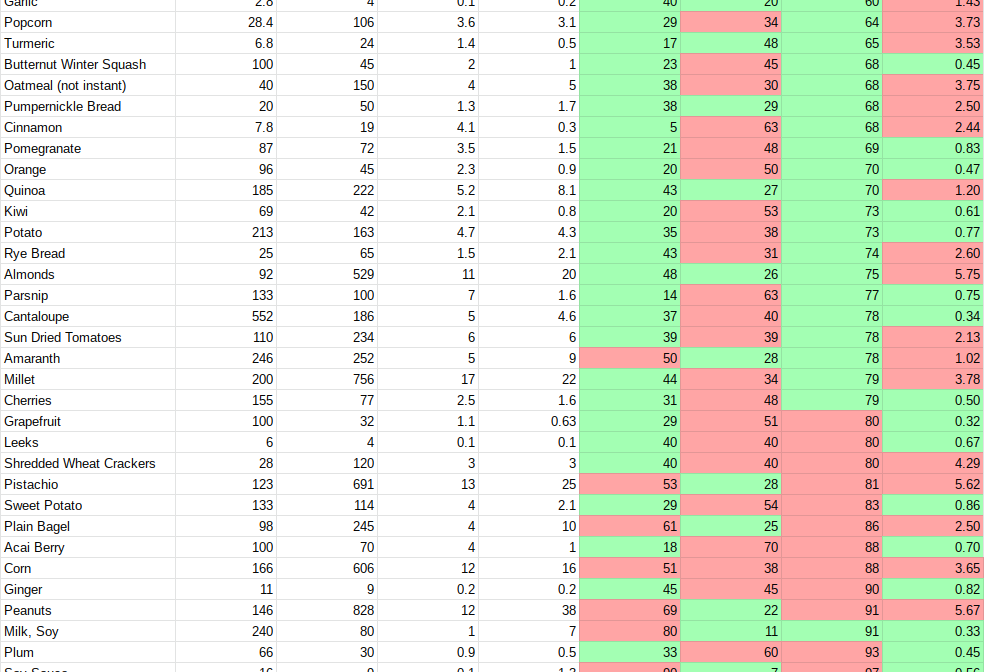
By now you’ve probably been asking yourself, “What’s with all the green and red squares?” Well, each square, or metric, tells you something meaningful about the resource that it belongs to. The expression and Metrics are at the heart of TWS. In fact, I created metrics first and then went back and uncovered the math behind it. The expression is the behavior of a resource. If the components are like the DNA of a resource, the expression is the physical manifestation. It is composed of 4 factors that are derived from formulas taken from the relationships between various components.

How do you determine the factors for a resource? You can use the following formulas to do so. In your system worksheet, make sure the expression is an actual formula instead of just a static number. Once you do this once, you should be able to reuse it for all other resources.

The Fiber Metric

By dividing the number of Calories by the amount of fiber, you will obtain a number that will help determine the overall fiber value of the resource. You can use this number when trying to decide between closely related resources. This is used to maximize fiber and minimize Calories. For example:

The F for 1 Nutrition Bar is 220 Cal/14g Fiber: 220/14 = 15.7F

This bar would be considered an overall great source of fiber value; anything less than 50F is an overall good choice. We can also tell how this nutrition bar compares to other bars in the grocery store, so you can get the bar with the highest fiber value. If there are no Calories, the F bottoms out at zero, and if there is no fiber, it is undefined.

The Protein Metric

By dividing the number of Calories by the amount of protein, you will obtain a number that will help determine the overall protein value of the resource. You can use this number when trying to decide between closely related resources. This is used to maximize protein and minimize Calories. For example:

The P for 1 Nutrition Bar is 220 Cal/13g Protein: 220/13 = 16.9P

This bar would be considered an overall great source of protein value; anything less than 30P is an overall good choice. We can also tell how this nutrition bar compares to other bars in the grocery store, so you can get the bar with the highest protein value. If there are no Calories, P bottoms out at zero, and if there is no protein, it is undefined.

The Wholeness Metric

By aggregating the F and P, you will obtain a number that will help determine the overall wholeness and nutritional value of the resource. You can use this number when trying to decide between closely related resources. This can also be used to maximize overall value and minimize nutritional incompleteness. For example:

The W for 1 Nutrition Bar is: 15.7F + 16.9P = 32.6W

This bar would be considered an overall great source of wholeness; anything less than 80W is an overall good choice. We can also tell how this nutrition bar compares to other bars in the grocery store, so you can get the bar with the highest overall nutritional wholeness. If either F or P are undefined, the W is also undefined.

The Energy Metric

By dividing the number of Calories by the amount of mass or quantity, you will obtain a number that will help determine the overall energy density of the resource. You can use this number when trying to decide between closely related resources. This is used to minimize high-Calorie foods or balance them out by pairing them with low-Calorie foods. For example:

The E for 1 Nutrition Bar is 100 Cal/25g: 100/25 = 4E

This bar would be considered too energetic to be eaten by itself; anything less than 1E is an overall good choice. We can also tell how this nutrition bar compares to other bars in the grocery store, so you can get the bar with the lowest energy density. If there are no Calories, the E bottoms out at zero, and if there is no quantity, it is undefined.

There are five main considerations to E, namely protein, sugar, oil, alcohol, and mass. These variables give you a formula for a quick estimation of E.

The way to read and understand this expression is as follows:

E = energy value, p = protein, s = sugar, o = oils, a = alcohol, m = mass

When E is low, p, s, f, and a also tend to be low, except for m which tends to be high. On the other hand, when E is high, p, s, f, and a tend to be high, except for m which tends to be low. That means that people who have high energy value eat small amounts of protein, sugar, fat, alcohol, and large amounts of mass like water. Similarly, people who have a low energy value eat large amounts of protein, sugar, fat, alcohol, and small amounts of mass like water.

You can see all 4 metrics in the figure below. A metric is either green or red depending on whether it meets the defined threshold. Metrics use thresholds instead of ranges. TWS thresholds are all inversely proportional. This means that lower numbers have higher values. You can see below that the first 3 metrics are below threshold and the last is not:

The Metrics Become the Wellness Formula

Using the four metrics above, we can blend them together into a system of literal equations. This system of equations is called The Wellness Formula and is at the fundamental core of each resource. Each resource has 4 components which are just inputs fed into the system. But once that happens, the system comes alive. Mathematically, the system emerges from the metrics:

In the first line, we see the basic relationships between the amounts of fiber, protein, and Calories. Then we add both of those equations together to understand the relationship between the first two metrics. The third equation defines W as a higher order metric, or rather a metric made of metrics. To simplify all this information, it is written in a straight-forward, user-friendly form.

The second equation in the formula, which is also the fourth metric, is already in simplest form:

Then we can group these simple equations together as a system:

This formula defines the operations that are performed on the components of each resource and is therefore responsible for the values of each metric. W tells us about the nutritional information of the resource, and E tells us about the leanness and energy density. Each equation operates independently from one another but says something unique about the resource in question.

Let’s do a very simple example of using The Wellness Formula:

Using the components f, p, and c, fill in the variables and solve for W:

Using the remainder of the components (m), solve for E:

Now we have a solution to each equation in the Wellness formula. Even though this resource doesn’t exist, we can still infer information about it for example, this imaginary resource is complete (has a solution for both sub-equations), it is very high in nutrition, and has an elevated E which indicates the presence energy. Since this doesn’t normally happen for a singular resource in nature, we can conclude that this must be a sandwich or a salad.

The Threshold Formula

Part of the basics of The Wellness System is the usage of thresholds and non-linear functions. It uses thresholds as a means of expressing desirable or undesirable behavior. One metric that is above a threshold is not a problem, however when every resource in your formation is red, that’s a clear indicator that you need to rethink your meal.

When working in your worksheet, it can be overwhelming with all the numbers flying around. So, I created the threshold formula to help you visualize the properties and the metrics of a resource. The Threshold formula is an auxiliary system of equations, part of The Wellness System, designed to help you make sense of all the data you are working with.

In each equation, the variable t represents a corresponding metric’s value. Also, every initial number is the threshold for that particular metric. Here is an example of reducing the threshold formula:

As you can see, this resource is undesirable. It is over threshold in every single metric, even though not by much. However, mixing it with a more desirable resource could make it more desirable.

Lets try out using the Wellness formula and the threshold formula with, say, bean sprouts:

First we solve for W by using the information on the nutrition label (c, f, p):

Next E. We solve for E by using the nutrition label as well (c, m):

Now we determine the threshold factors:

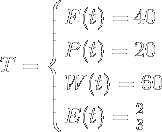
Initially, W and E have to be solved before we can begin to make inferences about the sprouts. After W and E are solved, we can begin to determine the threshold factors. First, we plugin the values for each t according to each threshold. Second, we solve for each equation and determine the threshold factor for each metric. This gives us a lot of detail about each metric instantly, i.e. all the metrics are under threshold (all positive), W has the highest score, this resource has twice as much fiber value as protein value, etc.

Comparative Analysis

You don’t have to apply both equations or use the threshold formula in order to make inferences about the component information. For example, you can use W to compare canned goods at the grocery store. Or you can use E to uncover which meat is leaner. But for example, we are going to perform a complete comparative analysis on these two protein shakes.

Evaluate the nutrition label on the left:

Evaluate the nutrition label on the right:

Now we can compare and analyze. I added the threshold formulas as well:

Now, this starts out a little deceptive. For any calorie counter, they would look at both and see that they both have the same number of calories. So they might think it’s a toss up and choose the one that looks more enticing. But there is useful information hidden in the label that TWS will bring out.

Looking at the Wellness formulas, the left has a high W which indicates very low nutritional value. The E is about average. The right has a lower W which indicates a higher nutritional value, and E is .4 which is about normal. Just by looking at the Wellness formulas, we can tell which is a better choice; the right one.

Just for fun, lets add the threshold formulas into the mix. Looking at the left thresholds, we can now see why the W is so high. The fiber value is 110 above threshold which pushes the W up to 90.6 above threshold. The protein value is not impressive, it’s close to threshold, and the E is normal.

When comparing resources, the difference between the two values for W will give you a gap between the value and the threshold. This is what the threshold formula measures. Secondly, the difference between the two values for E will give you a gap between the values and the threshold. You can then make an inference based on the two values.

Sometimes a component can be zero causing W to be infinite. For example, fiber is zero for meat resources. When fiber or protein is zero, the corresponding F or P is infinite. We can show that this is the case by decreasing the amount further and further towards zero and the result is a metric that grows higher and higher. So the actual metric for a zero fiber or protein amount is infinity.

This presents a challenge with W since it is the sum of F and P. If F or P is infinite, W is also infinite. For infinity plus a normal integer is infinity. Resources that have an infinite W are called incomplete and are usually sorted by the E instead of the W. This is why a map structure has two lists, one for complete resources (W is finite) and the other for incomplete resources (W is infinite).

You can still use incomplete resources for the value they contain. For example, meats are incomplete however they usually have some of the highest protein value of any resources. You don’t have to worry about division by zero in the components. A component that is zero will simply aggregate to zero.

If the number of Calories is zero and the fiber, protein, and mass are non-zero, the expression is all zeros. This rarely happens since the presence of protein has Calories. More common is when the mass is non-zero and Calories, fiber, and protein are all zero. This creates infinity in F, P, and W and zero in the E. This is the signature of water.

Here is a resource that has zero fiber and therefore an infinite F and W:

Notice how this resource still has useful information even though W is infinite; we know that E is .54 which is below threshold and that P is 5 which is way below threshold. So, even though egg whites have an infinite W, they are a fantastic choice for protein value and energy value.

The Wellness System Structures

The Wellness System is the mathematical underpinning for the calculators on this site. Structures are what give The Wellness System meaning. When you use the calculators, you are creating structures, namely a formation or a grid. By creating structures, you are able to organize and understand information with regard to your eating habits. There are 6 types of structures and each serves a purpose and bears a mathematical underpinning.

  • The Resource – the most basic structure, used as a building block
  • The List – the simplest multi-resource structure, used for resource access or analysis
  • The Formation – the structure intended for tracking
  • The Definition – the structure used to nest resources and save space
  • The Grid – the structure used for daily tracking and grazing
  • The Map – a double list structure organized by W and E used for resource reference and importation

Structures also have a behavior that allows us to analyze them in an organic manner. We can analyze lists and make generalizations about their contents. We can analyze formations which allows us to balance the composite. We can analyze grids which helps us to understand daily habits. We can analyze maps that tell us the nature of its resources.

The Resource Structure

“Resource” is a convenient way of saying “food” or “drink”. It is also the simplest, lowest-level structure in TWS. If the system is your body, the cell is a resource. Even though it can be divided into pieces, the resource is considered to be fundamental. The resource is an axiom. It is considered to be true since it is made of basic parts. The parts of a resource are:

  • Designation – the name of the resource
  • Components – the amounts of mass, Calories, fiber, and protein
  • Expression – the 4 metrics derived from the relationships between the components

A resource looks like this (open in new tab):

Resources are generally not accompanied by a header row, because they are never seen out of the context of a higher structure. However, for the sake of clarity, this graphic shows you the header information.

The List Structure

The list is a structure used for grouping resources and analysis. It is the simplest way to piece resources together and create a form of analysis through sorting. A list can reveal which resources are better with certain parameters. For example, a map sorts according to the W and the E. A list is most commonly used to group resources together. It is also used to create studies and proofs. The parts of a list are:

  • Header – designation (named or unnamed) and list parameters
  • Collection – a group of resources
  • Sort (optional) – parameter used for organizing the list

This is what a list looks like (open in new tab):

The Formation Structure

The formation is a structure designed for tracking. It is similar to the list, however it has a row at the bottom called the “composite” that is an aggregate of the list above. A formation tells you the estimated overall impact a group of resources has. It also serves as a form of analysis. If your composite is unbalanced, you should go back and analyze the collection, fixing problems until the composite is balanced. The parts of a basic formation are:

  • Header – designation (named or unnamed) and formation parameters
  • Collection – a group of resources
  • Composite – a row used for aggregating the collection and analysis

A formation is generally not sorted. This is what a basic formation looks like (open in new tab):

There are two other types of formations that are used for portioning and meal planning. A portioned formation has any number of “tags” that apply a factor to the formation’s composite. This is useful for portioning a recipe like cookies. The parts of a portioned formation are:

  • Header – designation (named or unnamed) and formation parameters
  • Collection – a group of resources
  • Tags – any number of factors applied to the composite (usually scale down). They live right under the composite.

This is what a portioned formation looks like (open in new tab):

Second, a portioned list formation is a formation with a repeated set of components. The components are copied under the composite and the factor is applied to each component. This is useful in portioning for multiple people. The parts of a portioned list formation are:

  • Header – designation (named or unnamed) and formation parameters
  • Collection – a group of resources
  • Composite – a row used for aggregating the collection and analysis
  • Portion Row – a row that declares the portion amount
  • Portioned Components – the components that have been multiplied by the portion amount

This is what a portioned list formation looks like (open in new tab):

The Definition Structure

The definition is designed for nested resources and reuse. If you find yourself copying and pasting large numbers of the same resources, creating a definition makes sense to save space and effort. The parts of a definition are:

  • Header – designation (named or unnamed) and definition parameters
  • Collection – a group of resources
  • Composite – a row used for aggregating the collection and analysis
  • Seed – a row designed for copying and pasting into other structures

This is what a definition looks like (open in new tab):

The Grid Structure

The grid is a structure designed for tracking daily resources. It also simplifies the composite by aggregating the whole day into one global composite; formations, on the other hand, must be tallied in order to determine the global composite. Also, the grid has spaces between resources and resource groups signifying the passage of time. Therefore, it helps you analyze your habits by being organized chronologically. The parts of a grid are:

  • Header – designation (named or unnamed) and grid parameters
  • Collection – a group of resources, resource groups, and spaces (sorted chronologically)
  • Composite – a row used for aggregating the collection and analysis
  • Seed – a row designed for copying and pasting into other structures

This is what a grid looks like (open in new tab):

The Map Structure

The map is the largest-scale structure, organized as a double list. The first is sorted by W and the second by E. The map is designed for reference. Those at the top are complete because they do not have division by zero. Those at the bottom are incomplete because they have natural division by zero. One list isn’t better than the other. We need complete resources and we need incomplete resources. The parts of a map are:

  • Header – designation (named or unnamed) and map parameters
  • Collection 1 – a group of resources organized by W
  • Collection 2 – a group of resources organized by E

The resources map is designed to be read-only which means you can copy but you can’t modify. The personal resources map is designed to be modifiable.

This is what a map looks like (open in new tab):

The Wellness System and Calculators

Once you understand the map structure, you will be able to use the smart and the energy calculators. These calculators are sorted according to the W factor or the E factor or both so you will be able to use the sort range as a means of choosing the resources you want to consume. If you want to use The Wellness System in addition to the calculators, you can find it at https://www.thewellnesssystem.org/ It is more powerful than the calculators but it is also more work.

Smaller Portions, Larger Variety

For most people, a meal consists of 3-4 resources either mixed together in a sauce, baked, or eaten separately. In my experience, the problem with this approach is getting enough food variety especially when eating the same things over and over again. Also, I tend to eat larger portions to compensate for the fewer resources. So what can be done about it?

Smaller Portions

Instead of eating a whole sweet potato, I cut it into 3rds and only eat 1/3 for a reduced portion size. I did this with everything on my plate and I found that I needed to eat more. However, instead of increasing the portion size to eat more, I increased the variety of resources on my plate.

Larger Variety

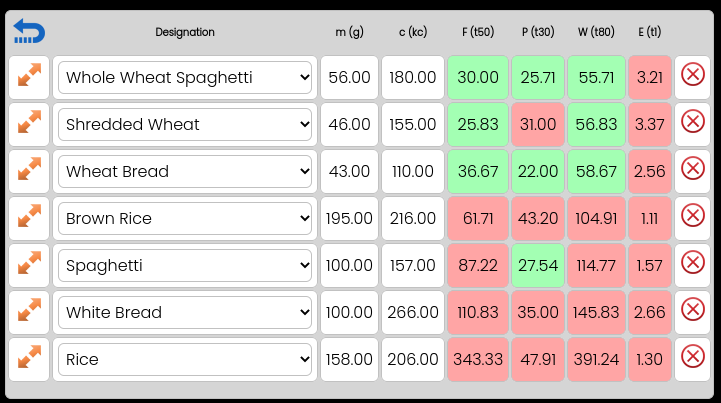
Eating a larger variety of foods brought me a greater array of micronutrients. Instead of just eating more, I was increasing the quality of my meal by choosing resources from different resource groups. Soup or salad is a great vehicle for variety. Below is a list of resources from various resource groups.

Grazing vs. Meal Eating

Meal eating can be problematic when maximizing variety because of the need to buy, cook, and portion a larger number of ingredients. By spreading out eating over time, it becomes easier to increase resource variety and reduce portion sizes. Is one approach better than another? No, whatever works for you is what you should do. If you’re a meal-eater, try grazing for a week or two and see if it works for you. If you’re a grazer, try meal eating for a week or two and see how you like it.

Probiotics and Prebiotics

Most people have heard of probiotics: tiny micro-organisms that live in your colon. They are essential to a healthy GI system. But many people may not have heard of prebiotics. We’ll go over both in detail so you’ll know exactly how to supplement and eat for maximize gut health.

What are probiotics?

Probiotics are tiny microbes (bacteria) that live in your colon and help break down fibers that the digestive system can’t break down on its own. Think of your gut as a fish tank; the fish tank is your gut and the fish are the probiotics. The good bacteria help keep the bad bacteria in check. There are over ten times the number of bacteria in your gut as there are cells in your body! Some examples of probiotics are:

  • Yogurt
  • Kefir
  • Kombucha

What are prebiotics?

Prebiotics are soluable fibers that travel to your colon where they are fermented and turned into energy for the good bacteria. If your gut is a fish tank, the fish are probiotics and the fish food is prebiotics. Prebiotics are essential to feed the probiotics in your gut. Some examples of prebiotics are:

  • Chicory Root
  • Dandelion Greens
  • Jerusalem Artichoke
  • Garlic
  • Onions
  • Leeks
  • Asparagus
  • Bananas
  • Barley
  • Oats
  • Benefiber

Resistant Starches

Resistant starches are foods that function as prebiotics. They are not absorbed by the small intestine and travel to the colon where they are fermented and turned into short-chain fatty acids. Then, they are used as a booster for the bacteria in the gut. Resistant starches are considered prebiotic if they satisfy these three criteria. Some examples of resistant starches are:

  • Plantains and Green Bananas
  • Beans, Peas, and Lentils
  • Whole grains and Barley
  • Cooked and cooled Rice, Potatoes, Beans, Pasta
  • Overnight Oats

Understanding how to supplement your gut with prebiotics and proboitics is key. Now try out some different strategies. For example, drink a kombucha every day and take Benefiber. Or eat yogurt with sliced green banana. Your microbiome will be rejoicing!

To Bean or Not to Bean

Beans have a lot of good things about them: they are high in nutrition and full of energy (carbs). One of the biggest problems is the presence of what are called Lectins, chemicals that are found in nature to prevent the beans from being foraged. In order to get rid of the toxic Lectins, beans must be thoroughly soaked and cooked before eating.

In my experience, beans are too much work for not enough reward. I can eat other vegetables and get much more nutrient density than I do with beans. Therefore, beans are nice to eat once in a while but they contain too many carbs for someone who wants to become fat and keto adapted. If you are going to eat them canned, stick to plain beans, like black beans.

Sweetness

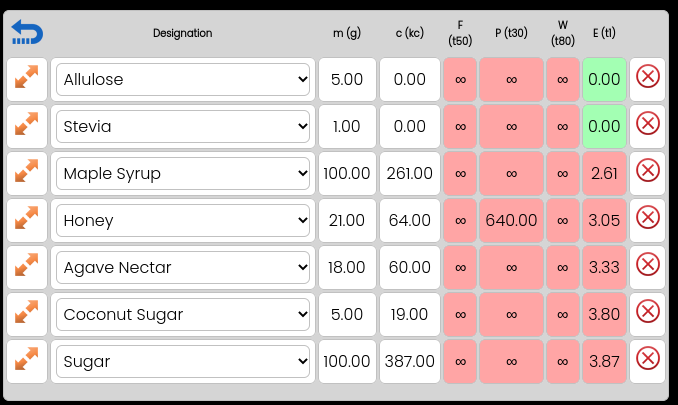
There really isn’t much of a difference when it comes to sugar, artificial or natural. They are calorie dense and have little to no nutritional value. The all-natural sweetners (the ones that contain nutrients and other molecules than just sugar) are honey, maple syrup, and molasses. When it comes to the best overall choice, it’s between Allulose or Stevia. Both are natural but are refined. Which to choose? It depends on your preference: Stevia is significantly sweeter than sugar so you can use much less of it, making it cheaper. Allulose is only 70% as sweet as sugar so you have to use more of it making it more expensive. However, Allulose has a better flavor and is better for baking than Stevia. I prefer Allulose because of the superior flavor.

Carbs (Harm Reduction)

Carbs, especially refined carbs contain anti-nutrients like gluten that are difficult to digest and have little nutritional value. When eating carbs, remember 2 things: 1) Whole wheat/sprouted grain does make a small beneficial difference. 2) Pasta tends to have more nutrition than bread or rice. I recommend finding creative ways to replace wheat-based carbs for example veggie noodles, black bean pasta, or Konjac rice or noodles.